Why monitor your microservices?
The complexity of distributed systems
If you’re juggling multiple services, it’s hard to track how they work together. OpenTelemetry lets you follow one request end to end and see where it went wrong, which is closer to a map than to a dashboard.
What poor observability costs you
Without tracing, a microservice architecture is a black box with good uptime graphs. Every incident starts with the same twenty minutes of asking which service is at fault.
The challenge of microservices observability
Debugging distributed systems
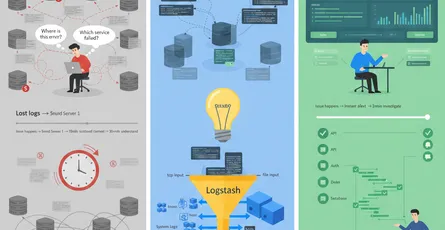
With microservices, one slow or broken part drags the rest down with it. Without a clear view of what’s happening, you’re guessing at which service to look at, and you’re guessing while the pager is going off.
The cascade effect
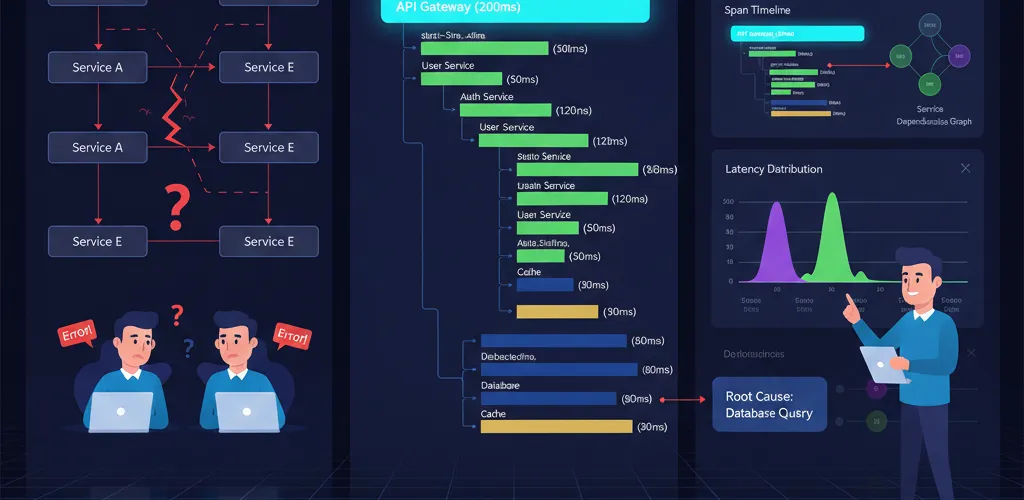
One failing service triggers timeouts in its callers, which trigger retries, which push load onto services that were fine a minute ago. By the time you look, five things are red and none of them is the cause.
Where logs and metrics stop helping
Metrics tell you latency went up. Logs tell you what one service did. Neither one connects the log line in your API to the log line in the database wrapper three hops later, and that connection is the thing you actually need.
The fix: OpenTelemetry distributed tracing
How distributed tracing works
OpenTelemetry is a free, open source toolkit that tracks requests as they move through your services. Each service records a span, the spans carry a shared trace ID, and the collector stitches them back into one timeline.
Instrumenting your services
Add the OpenTelemetry libraries to your code, then run a collector to receive the data and forward it to something like Jaeger or Zipkin. Auto-instrumentation for HTTP clients and database drivers gets you most of the picture before you write a single manual span.
Reading the traces
What you get is a waterfall: one bar per span, nested by caller. The slow hop is the wide bar, and the failed hop is the red one. That is usually the whole investigation.
Implementation steps
Adding the libraries
- Add OpenTelemetry libraries to your services.
- Set up a collector to feed data to a visualization tool.
- Check traces regularly to spot and fix issues fast.
Configuring the collector
Point your services at one collector rather than at the backend directly. It handles batching, retries and sampling, and it means switching from Jaeger to a hosted platform later is a collector config change instead of a redeploy of every service.
Keeping up with it
Look at traces when nothing is broken, not only during incidents. Knowing what a healthy trace looks like is what makes an unhealthy one obvious, and it’s how you notice the retry loop that has been quietly doubling your database load.
What tracing gives you
Faster resolution
You stop reading five log streams and start reading one timeline. The question changes from “which service is slow” to “why is this span slow”, and that second question has an answer.
Fewer cascading failures
Catching the slow dependency early keeps it from turning into timeouts, retries and a system-wide incident.
A real picture of your dependencies
Traces show the calls your architecture diagram forgot. Every team I’ve watched turn tracing on has found at least one call nobody meant to make.
What’s your monitoring strategy?
Community approaches
How do you keep tabs on your microservices? Got any favorite tools to share?
Tool comparisons
Jaeger, Zipkin and DataDog all pull this off, with different amounts of running your own storage. I’d like to hear which trade-off you took and whether you’d take it again.